ReviewEcon.com

AP, IB, and College Microeconomic and Macroeconomic Principles 

Complete Guide to the Production Possibilities Curve

Production Possibilities Curve

Updated 3/21/2024 Jacob Reed
Guns or butter? Capital goods or consumer goods? Robots or corn? Cakes or cookies? As you learned from the “What Is Economics?” article, every economy must make choices about how to use scarce resources and what goods and services to produce with those resources. 

Production Possibilities Graph

The production possibilities curve (sometimes called the production possibilities frontier) illustrates the trade-offs and opportunity costs of production choices. The production possibilities curve is important to both microeconomics and macroeconomics, so make sure you review it before your next Advanced Placement (AP), International Baccalaureate, or College Microeconomics or Macroeconomics exam.

What is the production possibilities curve?

The production possibilities curve (PPC) is a graph that shows all combinations of two goods or categories of goods an economy can produce with fixed resources.

Take the example illustrated in the chart. This chart shows all the production possibilities for an economy that produces just two goods; robots and corn. The chart shows the different combinations of robots and tons of corn the economy could produce. If all resources were devoted to the production of robots, the economy would produce 100 robots, but zero tons of corn. On the other end of the chart, we see the other extreme where all resources were devoted to the production of corn. 50 tons of corn could be produced, but then zero robots would be produced. Intermediate combinations of corn and robots are also shown.

Production Possibilities Chart

When all possible combinations for the production of corn and robots are graphed, we get a production possibilities curve. This curve shows the maximum levels of production possible for this economy.

PPC with numbers

The PPC can also be graphed without any numbers or points. This is how you will see the PPC most of the time in a economic principles course. All points along the PPC are possible combinations of robots and tons of corn that could be produced by this economy.

PPC with no numbers

How are points of production illustrated on the PPC?

Since all points on the curve are maximum levels of production, any point on the curve is productively efficient. Productive efficiency means you are getting the most out of your resources. It is important not to place a value judgement on this economy. Whether they choose to produce only corn, only robots, or some combination of both, it is productively efficient.

Note: In Microeconomics, productive efficiency is also the quantity found at the minimum of the average total cost curve (ATC).

PPC Productive Efficiency

Any point of production inside the curve is considered inefficient because the economy is not fully utilizing its resources. In macroeconomics, points inside the curve are used to illustrate a recession. In a recession, unemployed workers are not producing goods and services, so the economy is not producing its long run potential.

PPC Inefficient

Since the PPC represents maximum levels of production, all points of production outside the PPC are not possible.

PPC impossible

What shifts the PPC inward or outward?

Increases in the quantity or quality of resources will shift the PPC outward, making it possible to produce greater quantities of both goods. Increases in the quantity of resources include more land, labor, or capital. Increases in the quality of resources most often focus on expanding human capital (skill and knowledge of labor), but could also include anything that makes land, labor, or capital more productive.

Decreases in the quantity or quality of resources will shift the PPC inward. This decreases the possible production of both goods. 

PPC shift out
PPC shift in

If an increase in the quality or quantity of resources (including technological changes) only benefits the production of one of the products, only that side of the PPC will move outward. For example, the development of new fertilizing techniques or improved human capital for farm workers would increase the possible production of corn without impacting the possible production of robots. That would cause the corn side of the PPC to move outward. This shift would also increase the opportunity costs of producing robots while decreasing the opportunity costs for producing corn.

PPC technology shift out

How do you find opportunity costs on the production possibilities curve?

Opportunity cost is what you lose out on when you make a choice. Production possibilities curves show opportunity costs associated with different levels of production. As the economy below increases production of corn, it loses some amount of robots (and vice versa). 

Opportunity costs can be found and calculated (when there are numbers) from a production possibilities curve. To figure out the opportunity cost of a given change in production just check the axes and do the math. If production for this economy moved from point A to point B the production of corn would increase from 20 tons to 35 tons. But those extra 15 tons (35-20) of corn are not free. That is because the production of robots is reduced from 90 to 70. So, the opportunity cost of those extra 15 tons of corn is 20 robots (90-70). Likewise, moving production from point B to point A comes at a cost of 15 tons of corn.

PPC Opportunity Costs
PPC Opportunity Costs on graph

What is the difference between a concave PPC and a linear PPC?

When a PPC is concave (bowed out) from the origin, opportunity costs increase as the production of either good increases. Look at the PPC for corn and robots. In this economy increasing the production of corn doesn’t cost very many robots at first. Continuing to increase the production of corn costs greater and greater quantities of robots with each successive increase in the production of corn. You can see the increasing opportunity cost on the graph. Constant increases in the production of corn have increasing costs in terms of robots.

PPC Increasing Costs

Increasing opportunity costs is caused by differences in the adaptability of resources used in the production of corn and robots. In other words, the resources needed to produce corn are different than the resources used to produce robots. Let’s say this economy is producing only robots and no corn. If they decide to start producing some corn, they would have farmers (who are skilled in the production of corn and not skilled in the production of robots) stop making robots and start making corn. As a result, the economy doesn’t have to give up many robots to get a fair amount of corn. Continuing to increase the production of corn means electrical engineers and computer programmers who have no skill in corn production will stop making robots and start producing corn. That means a larger number of robots will have to be given up to get the same amount of corn.

When a PPC is a straight line, opportunity costs will be constant. This is caused by perfect adaptability of resources used to produce both goods. In other words, the resources used to produce one good will be easily converted to the production of the other good.

An example of a straight line PPC might be an economy that produces cakes and cookies. Assuming cakes and cookies use the same ingredients, land, labor, and capital, opportunity costs would be constant. So, increasing the production of cakes by constant amounts does not change the opportunity cost. The ratio remains constant throughout the straight line PPC. 

PPC Constant Costs

Note: In Macroeconomics, the PPC is most often about two categories of goods that illustrate the entire economy instead of two specific goods. You could see Guns vs Butter, but Capital goods vs. Consumer goods is the most common macro label. One note for macroeconomics is to realize greater production of capital goods shifts the entire PPC outward more quickly. That is, capital formation causes economic growth.   

Multiple Choice Connections:
2012 Released AP Microeconomics Exam Question: 2

Up Next: 
Review Game: Production Possibilities Review Activity
Graph Drawing Practice: PPC
Content Review Page: Comparative Advantage and Terms of Trade

Other recommended resourceVideo from youtube

Production Possibilities Curve

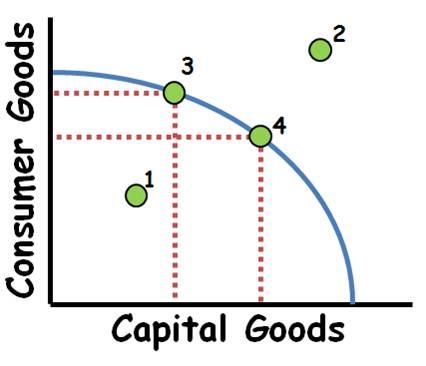
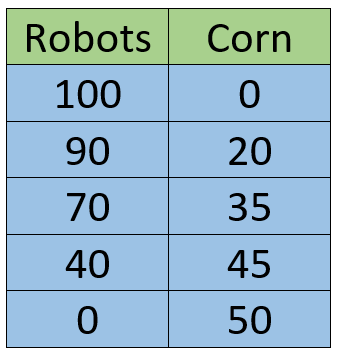
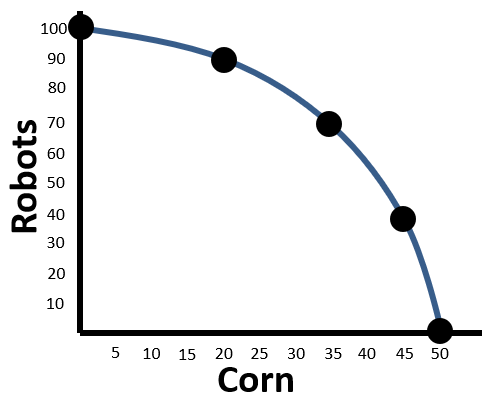
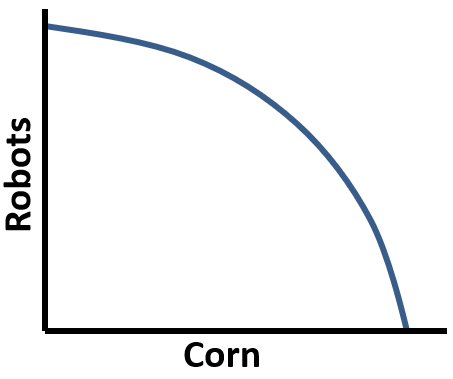
 ​     Here are some key concepts and an activity I just finished to help you practice working with the Production Possibilities Curve. This one applies to both Micro and Macro economics. This graph always shows up on both exams. There are 20 different scenarios to test your knowledge. Give it a try and see if you have what it takes to answer all 20 correctly!