6/7/2020 Jacob Reed
A production function serves as the foundation for business decisions regarding resource use and quantities of output. Below you will learn about the law of diminishing marginal returns and how it relates to the marginal cost curve.

Production Function Key Terms:
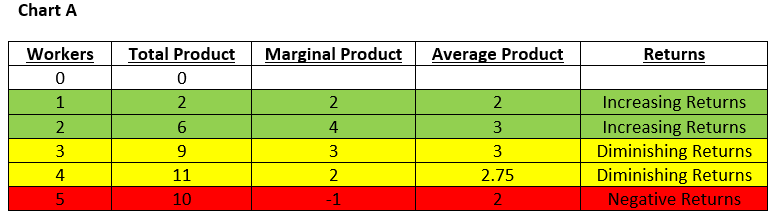
Total Product (TP) is the number of units a firm can produce with a given quantity of inputs. You will see total product in the chart below. With 2 workers the firm has a total product of 6 units of output. With 3 units of labor, the firm has 9 units of total product.Average Product (AP) is the total number of units a firm produced divided by the quantity of inputs used. At 2 workers, total product is 6, that means average product is 3 (6/2)
Marginal Product (MP) is the change in total product (the number produced by all workers) from hiring one more worker. If more than one worker is hired, the marginal product is the change in output (Q) divided by the change in the quantity of labor. With 2 workers, the firm has a total product of 6, and with 3 workers the total product is 9. The total product increased by 3 units with the addition of 1 worker so the marginal product is 3 (3/1).
Below is a short run production function for a firm. You can see the total product, marginal product, and average product for different units of labor (workers) employed.
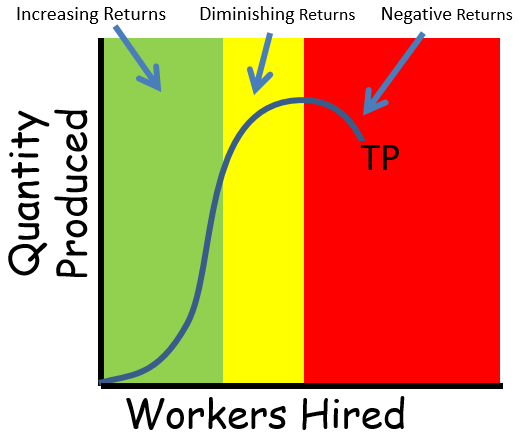
The law of diminishing marginal returns: There are three parts of a marginal product curve. Part 1 is the increasing returns portion where hiring more workers increases the marginal product because total product is increasing at an increasing rate. Increasing returns occurs because of division of labor and worker specialization. Complicated tasks are broken down and workers get very good at their individual role in the production process.
Part 2 is the diminishing returns portion where hiring more workers decreases the marginal product (the Total Product curve is getting less steep) because total product is still increasing but at a decreasing rate.
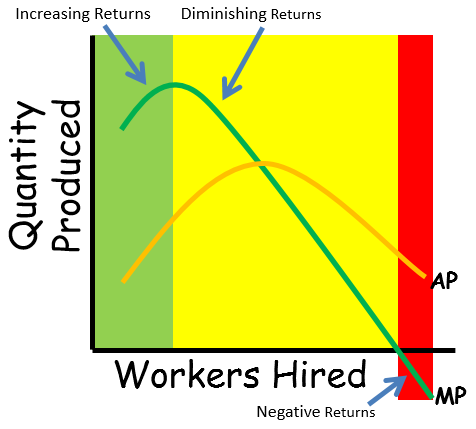
Part 3 is the negative returns portion where hiring more workers results in a negative marginal product (the total Product curve is falling). Take a look at Chart B and the graph below for an example.
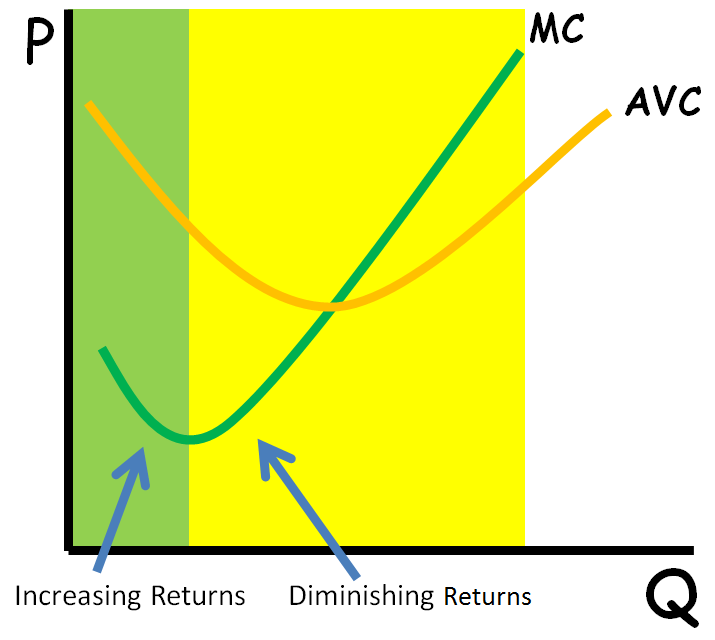
Note: Diminishing Marginal Returns is the cause of the upward sloping portion of a firm’s marginal cost curve.
A marginal product curve tends to be shape like an upside down marginal cost curve and an average product curve tends to be shaped like an upside down average variable cost curve. That is because, for most businesses, the primary variable cost of production is the cost of labor. Also, when labor is the only variable cost the marginal cost of labor is the wage divided by the marginal product (MC=W/MP). So when MP is rising, MC is falling, and when MP is falling, MC is rising.