
4 Keys to Trade and Tariff Graphs
Updated on 3/22/2024 Jacob Reed
1. How do domestic supply and demand determine price without trade?
To understand the ins and outs of trade and tariff graphs, you first need to have a firm grasp on the basics of supply and demand. Assuming you have that, we are ready to begin.

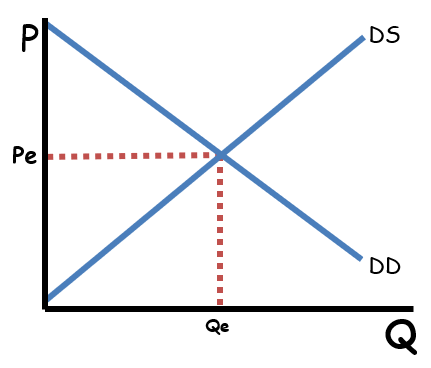
Let’s use the oil market as an example and start with an economy that does not trade oil with other countries. That means the equilibrium price (Pe) and quantity (Qe) for oil within the country will be determined by the intersection between domestic (as opposed to foreign or worldwide) supply (DS) and domestic demand (DD).
As you may have already learned, when the market reaches equilibrium consumer surplus will be the triangle above the price up to the demand curve and the producer surplus will be the triangle below the price down to the supply curve.
2. How is the world price determined and how does it impact the domestic market?
Internationally the price of oil will be determined by the international supply and demand for oil. Since the international market is so much larger than the domestic market, domestic consumers and domestic producers will not be able to impact the international price. As a result, the international price creates a perfectly elastic (horizontal) world supply curve (Ws) at the world price (Pw). If this country trades oil with other countries, consumers will be able to purchase all the oil they want at the world price and producers will be able to sell all the oil they want at the world price.
If the world price is lower than the domestic equilibrium price (as it is in our example), producers will not produce Qe. They will lower production to the quantity where the domestic supply intersects the world price (Q1). Also, consumers will increase their consumption of oil and will purchase the quantity where the domestic demand intersects the world price (Q2). Since only Q1 will be produced but Q2 will be consumed, the difference (Q2-Q1) will be imported.
Due to the lower world price, producer surplus decreases. It is found in the triangle from the world price down to the domestic supply curve. Consumer surplus increases dramatically; by much more than the amount of producer surplus lost. It is found in the triangle from the world price to where it intersects the domestic demand curve up to the domestic demand. As a result of the imported consumption, total economic surplus (consumer surplus + producer surplus) within this market increases.
3. How will a tariff impact a market?
As you can see, consumers of oil in this example would greatly benefit as a result of this economy opening up to trade and allowing oil to be bought and sold at the world price. But oil producers and the employees of oil producers will be hurt. Oil industry workers will have fewer jobs and oil producers will most certainly have lower profits. As a result, the country may impose a tariff (a tax on an import) on oil to help (protect) the domestic oil industry.
If a tariff is imposed, the new price will be the world price plus the tariff (Pw + tariff). This shifts the world supply upward by the amount of the tariff; making the new world supply Ws + tariff.
At this new higher world price (thanks to the tariff) domestic producers will produce higher quantities. That is because domestic producers do not have to pay the tariff, but they do get to charge the new higher price. So, domestic production will increase to Q3 (from Q1). Also, at the new higher price, consumers will demand fewer barrels of oil so consumption will decrease from Q2 to Q4. This economy will still import oil but will import fewer barrels (Q4-Q3 instead of Q2-Q1).
4. How does a tariff impact efficiency?
The tariff will increase producer surplus and will bring in tax revenue for the government (perhaps to produce public goods) but consumers will have to pay a higher price and their consumer surplus will be reduced. The tariff will also create deadweight loss (AKA efficiency loss). A tariff is not considered efficient as a result.
Now that you have a good grasp on how trade and tariffs impact the supply and demand graph, practice with these graphs in the shading practice or important prices, points and quantities game.
Note: Import quotas have a similar impact on a domestic market as tariffs do. Trade quotas establish a quantity or monetary limit on the amount of a good that can be imported. They help the domestic industry, but they create deadweight loss and hit consumers with higher prices in much the same way tariffs do.

Up Next:
Review Game: Shading Practice and Prices, Points, and Quantities
Content Review Page: Consumer Behavior