
3 Keys to the Phillips Curve Model
Updated 11/17/2021 Jacob Reed
The Phillips Curve is one of those concepts that hasn’t been a large focus of the Advanced Placement Macroeconomics exams in the past. But this model shows up often enough that it is important for students to understand what it is, how to draw it, and how macro events impact the graph. Below you will find an overview of its parts and curve shifters. When you are done, head to the Phillips Curve Graph Flash review game to test your understanding of this sometimes tricky graph.

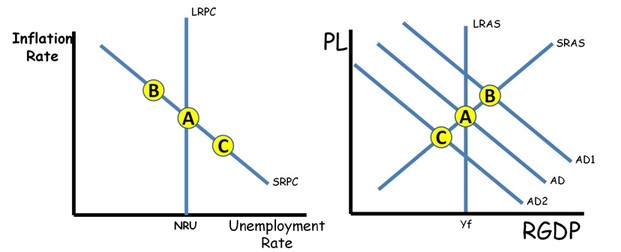
1. Axes: The Y axis on the Phillips Curve graph is the inflation rate. This is similar to the Price Level found in the AS/AD model. When the price level increases on the AS/AD graph, the inflation rate increases on the Phillips curve. The X axis on this graph is the unemployment rate. This is essentially the opposite of the AS/AD graph where the X axis is Real GDP; which correlates to employment in the economy.
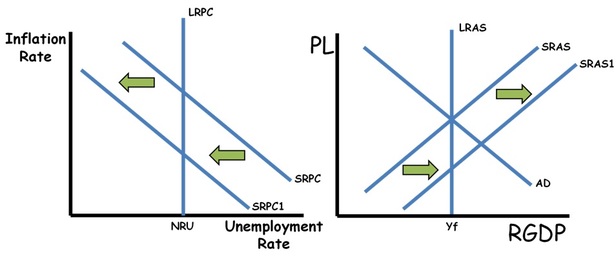
2. Short-Run Phillips Curve: The SRPC is a downward sloping curve which shows the inverse relationship between the inflation rate and unemployment in the short-run. Generally, as unemployment increases, the inflation rate decreases, and as unemployment decreases, the inflation rate increases. In many ways, the SRPC curve can be thought of as a mirror image of the SRAS curve. As the AD shifts, moving the point of intersection on the SRAS, there is a mirrored movement along the SRPC (see illustration). Demand shock inflationary gaps cause movement up the SRPC and demand shock recessionary gaps cause movement down the SRPC.
The SRPC shifters include supply shocks and inflation expectations. Anything that would shift the SRAS curve to the right, will shift the SRPC to the left. Anything that would shift the SRAS curve to the left, will shift the SRPC to the right. Also increased inflation expectations will shift the SRPC up (to the right) and decreased inflation expectations will shift the SRPC down (to the left).
3. Long-Run Phillips Curve: In the long run, there is no relationship between the unemployment rate and the inflation rate. In fact, regardless of the inflation rate, the economy will find its way to the Natural Rate of Unemployment (NRU). As a result, the LRPC is a vertical curve at the NRU (4.8% in the US according to the Federal Reserve). Since the Natural Rate of unemployment (full employment) is structural unemployment plus frictional unemployment, anything that will change structural unemployment or frictional unemployment will shift the LRPC. A higher NRU shifts the LRPC right, and a lower NRU shifts the LRPC left.
At the intersection of the long-run and short-run Phillips curve, the expected inflation rate is found. The actual inflation rate can be higher or lower (depending on where the economy is on short-run Phillips curve). Where there is an inflationary gap, the actual inflation rate will be higher than expected. When there is a recessionary gap, the inflation rate will be lower than expected.
Up Next:
Review Game: Phillips Curve Flash Review Game
Graph Drawing Practice: Phillips Curve
Content Review Page: Money
Outside Resource: ACDC