
Microeconomics Graphs Shading
Updated 5/19/2016 Jacob Reed
Over the last several years, there have been a lot of FRQ’s on the Advanced Placement Microeconomics exam which required shading different areas on a graph. This can be tricky for students who don’t realize the shaded shape on the graph really represents the numbers involved in the calculation of a critical component of market and firm analysis. Make sure you review these before exam day!
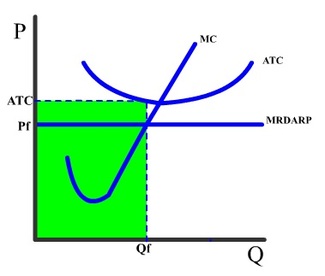
Take total revenue on a graph for example. Since there is no total revenue curve on a firm or market graph, you have to work with what is there. The axes give the price and quantity. So in a market, the equilibrium point along with the price and quantity for that point create a square of total revenue. In the firm, the profit maximizing quantity, the price (from the DARP curve at the profit maximizing quantity) create the total revenue for the firm. So when looking for taxes, tariffs, and totals, form a square using the dollars (height on the Y axis) and the applicable quantity (base on the X axis). If a question asks what this amount is, just calculate the area of that square (base times height).
There are also a lot of triangles or irregular pentagons that required shading with questions on deadweight loss and consumer surplus. For surplus, you just need to find the current price and quantity exchanged (the lowest of either quantity demanded or supplied at that price), then go up or down to the applicable curve (up to the demand curve for consumer surplus or down to the supply curve for producer surplus).
For deadweight loss, the main thing you need to look for is lost economic surplus. A strategy that works with everything except a tariff is to find the true marginal benefit (the demand curve or MSB for externalities) of the current quantity, the true marginal cost (the supply curve or MSC for externalities), and the allocatively efficient point. These three points form the triangle of deadweight loss. If asked to calculate the amount of deadweight loss or surplus, just find the area of the triangle (base times height divided by two).
Up Next:
Reveiw Game: Microeconomics Graphs Shading Flash Activity
Content Review Page: Microeconomics Graphs’ Important Points, Prices, and Quantities
Other recommended resources: Crash Course Economics (Price Controls), Economics Fun (Price Controls), No Bull Economics (Excise Taxes,) Economics Fun (Tariffs), No Bull Economics (Perfect Competition), ACDC Leadership (Monopolistic Competition), Jason Welker (Oligopoly), ACDC Leadership (Monopoly), No Bull Economics (Positive Externalities), ACDC Leadership (Negative Externalities)