
Perfectly Competitive Factor Market Firms
Updated 9/27/2021 Jacob Reed
Factor markets are an important part of any Microeconomic Principles class. If you are preparing for an Advanced Placement (AP), IB, or college exam, reviewing these markets is essential.

Below is a quick examination of the important aspects of perfectly competitive factor markets. If you haven’t already learned about MRP and MRC calculations, make sure you go review them first before moving on.
Note: The examples below use labor but these concepts apply to a firm’s use of capital and land as well.
The Market
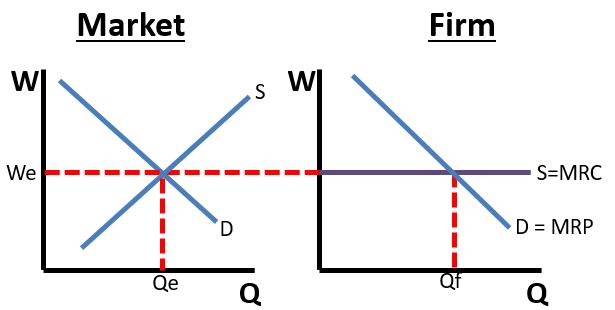
When drawing a perfectly competitive factor market, there are generally two side by side graphs; one for the industry (the market) and one for the firm. The industry (or market) is a standard supply and demand curve. The equilibrium wage (price) in the market establishes the wage each firm will pay its workers. The supply of workers is derived from the number of workers willing to work at each possible wage (equal to workers’ opportunity costs). The demand curve in a perfectly competitive labor market is derived from the demand for the product the workers produce and the productivity of the individual workers.

The Firm
Marginal Resource Cost (MRC): Sometimes called Marginal Factor Cost (MFC) is the firm’s cost of hiring more workers. In a competitive labor market, the MRC will be the equilibrium wage.
A firm will hire workers as long as the MRP is greater than the MRC. The profit maximizing number of workers to hire is where the MRC = MRP. If the wage paid to all workers was $10, then in Chart B above, the firm would hire 4 workers because the marginal revenue product for 4th worker is $10 and that equals the marginal factor cost of that worker.
Since each firm can hire as many workers as it wants at the market wage, the labor supply curve for the firms is horizontal at the market wage. Also, the market wage equals the cost of hiring more workers so the supply curve equals the marginal resource cost (MRC). Any changes in the market wage will also shift the firm’s MRC and supply.
Firm’s Labor Demand: The firm’s demand curve is equal to the marginal revenue product (MRP) of the firm’s workers and it is downward sloping. A profit maximizing firm will hire the number of workers where the MRC=MRP.
For the firm, the demand curve will shift with changes in the firm’s worker productivity, demand for the firm’s products, and the price of the product (all three change the MRP). A firm’s supply curve shifts up or down with the market wage. See below for how to draw a perfectly competitive factor market with side by side graphs.
Note: The trick to identifying a perfectly competitive resource market if there is a chart instead of a graph is that there will only be one wage.
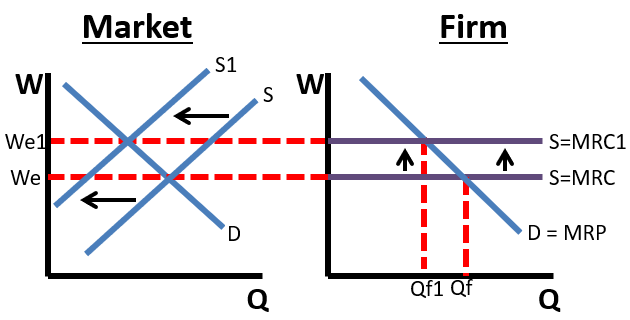
The graphs above show a decrease in the supply of labor. That causes the wage to increase, and with that the firm’s MRC (Supply) shifts upward. As a result, the firm hires fewer workers.
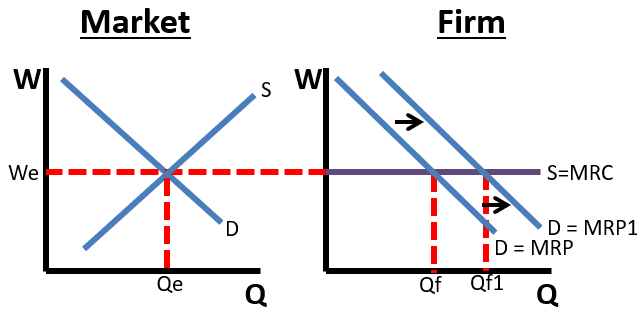
In this example, there was an increase in the marginal revenue product for just this firm’s workers. That could come in the form of better training for their workers, new technology only available to this firm, etc. As a result, the MRP shifts right and the firm hires more workers.
Using a chart to analyze perfectly competitive labor markets
It’s always important to remember the shapes on the graphs come from real numbers. Below you will find a production function for a firm that sells products in a perfectly competitive labor market and buys labor in a perfectly competitive product market. The firm will hire workers as long as marginal revenue product (MRP) of the last worker hired is greater than or equal to the cost of hiring that worker (MRC). The firm will not hire workers when the MRC is greater than the MRP for that worker.

In the chart example above, the price of the product is $10. The 2nd worker has a marginal product of 12, so the marginal revenue product (MP x Price) for that worker is $120. The highest wage this firm would be willing to pay to hire 2 workers is $120.
If the equilibrium wage (from the market) is $70, this firm would hire 3 workers. That is because the 3rd worker has a marginal revenue product greater than $70 (there is $10 additional profit earned by hiring this worker) and the 4th worker has a marginal revenue product less than $70. This firm would never voluntarily hire the 5th worker as that worker has a negative marginal revenue product.
Up Next:
Review Game: Points, Prices, and Quantities
Graph Drawing Practice: Factor Markets and Market Failures
Content Review Page: Monopsony
Multiple Choice Connections:
Competitive Labor Market
2012 Released AP Microeconomics Exam Questions: 13
Perfectly Competitive Firm
2012 Released AP Microeconomics Exam Questions: 26, 56, 58
Other recommended resources: mjmfoodie (Perfect Competition Factor)