8 Macroeconomics graphs you need to know for the Exam
Updated 5/9/2021 Jacob Reed Below you will find a quick review of all the graphs that are likely to show up on the Advanced Placement Macroeconomics exam.
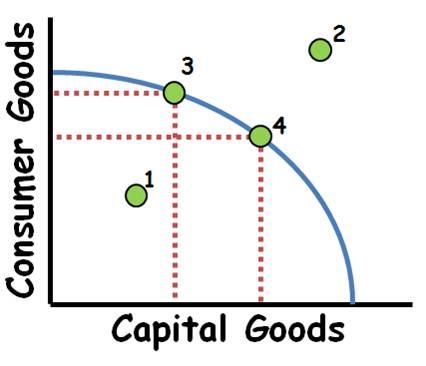
1.Inefficient use of resources, but it is possible to produce at this point. 2.Scarcity prevents this level of production without new resources. (trade may also make this point possible). 3 to 4 Increasing opportunity costs if PPC is concave. This is due to resources not being equally adaptable both products. For constant costs the PPC will be a straight line. •Increases in the quality or quantity of resources as well as technological improvements will shift the PPC outward. •Decreases in the quality or quantity of resources will shift the PPC inward.
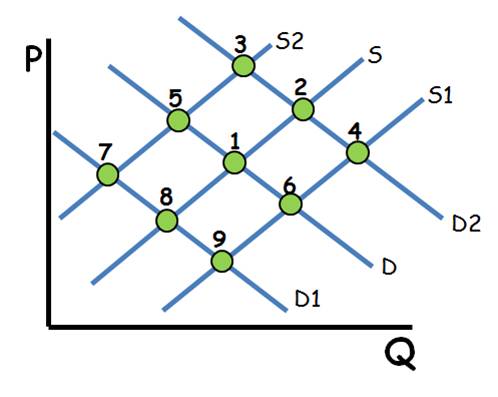
Single Shifts •Demand ↑=P ↑ Q ↑: Point 1 to 2 •Demand ↓=P ↓ Q ↓: Point 1 to 8 •Supply ↑= P↓ Q↑: Point 1 to 6 •Supply ↓= P ↑ Q↓:Point 1 to 5 Double Shifts •When 1 axis shows an increase then decrease with each shift, that axis is indeterminate. •Demand ↓ Supply ↓ P Indeterminate Q ↓:Point 1 to 8 to 7. •Demand ↑ Supply ↑ P Indeterminate Q ↑: Point 1 to 2 to 4. •Demand ↑ Supply ↓ P ↑ Q Indeterminate: Point 1 to 2 to 3. •Demand ↓ Supply ↑ P ↓ Q Indeterminate: Point 1 to 8 to 9
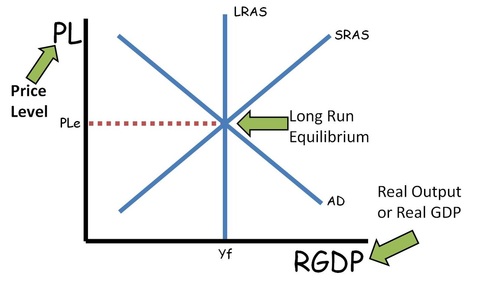
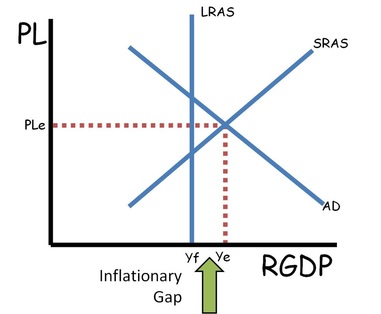
Aggregate Supply and Aggregate Demand (The AS/AD Model)
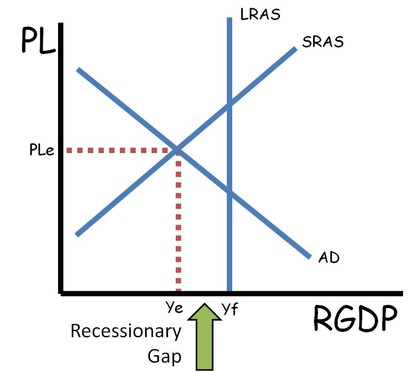
•LRAS is equal to the full employment level of output. •In the long run the economy will always return to LRAS. •In the short run the economy can have an inflationary gap (output above LRAS) or a recessionary gap (output below LRAS) •AD is equal to GDP and C+Ig+G+Xn •The government can use fiscal policy to shift AD right or left. •The Fed can use Monetary Policy to shift AD right or left. •AS can shift because of changes in productivity, costs of inputs, or supply shocks. •The LRAS can shift based on anything that would move the production possibilities curve (see micro) •If the economy is not at long run equilibrium, workers will eventually get lower (Recessionary gap) or higher (Inflationary gap) wages which means a change in input costs causing a shift of the AS towards long-run equilibrium
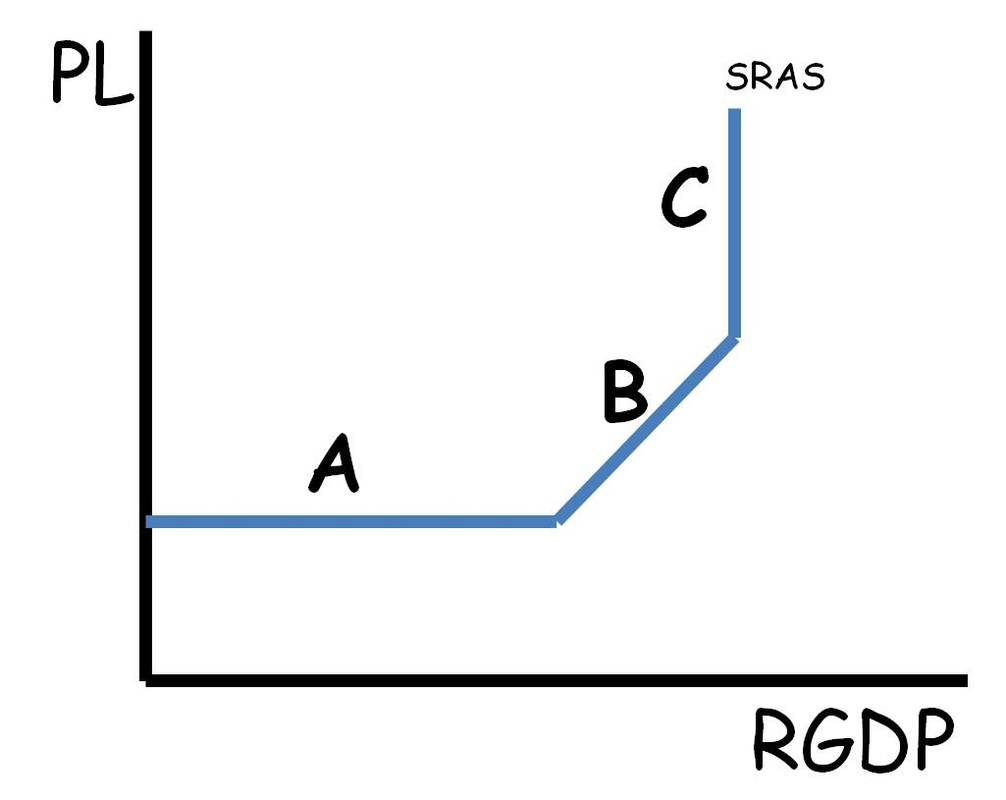
Parts of the Short-Run Aggregate Supply Curve
•The SRAS is the same thing as the AS curve •An economy with an AS curve like A will be able to increase output without increasing the price level. •An economy with an AS curve like B will be able to increase output while increasing the price level. •An economy with an AS curve like C cannot increase output. Only price levels can increase. **Remember the output and price level will be determined by the intersection between this curve and the AD curve (not shown)
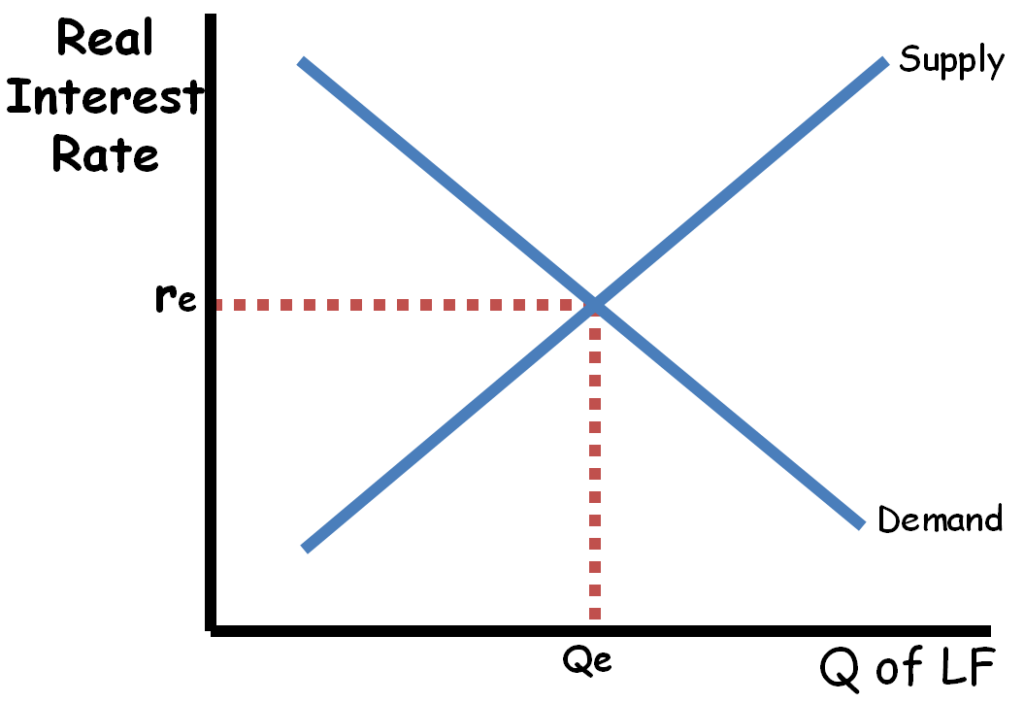
•The supply for loanable funds is determined by how much money is being saved in the economy. •The demand for loanable funds is determined by the amount of investment businesses would like to make. •If the government increases spending it causes a decrease in the supply of loanable funds (the government has taken them to deficit spend) that creates a higher interest rate. AKA “Crowding out.” (an increase in the demand of loanable funds instead of a decrease in supply is also acceptable) •If the government decreases spending it causes an increase in the supply of loanable funds that creates a lower interest rate. AKA Crowding in. (a decrease in the demand of loanable funds instead of an increase in supply is also acceptable) •The interest rate effects the quantity of investment in an economy (part of GDP) so a change in the interest rate will cause a shift in the AD curve. •The foreign exchange markets can also affect loanable funds. i.e. If financial capital is flowing into a country (capital account) there will be an increase in the supply of loanable funds.
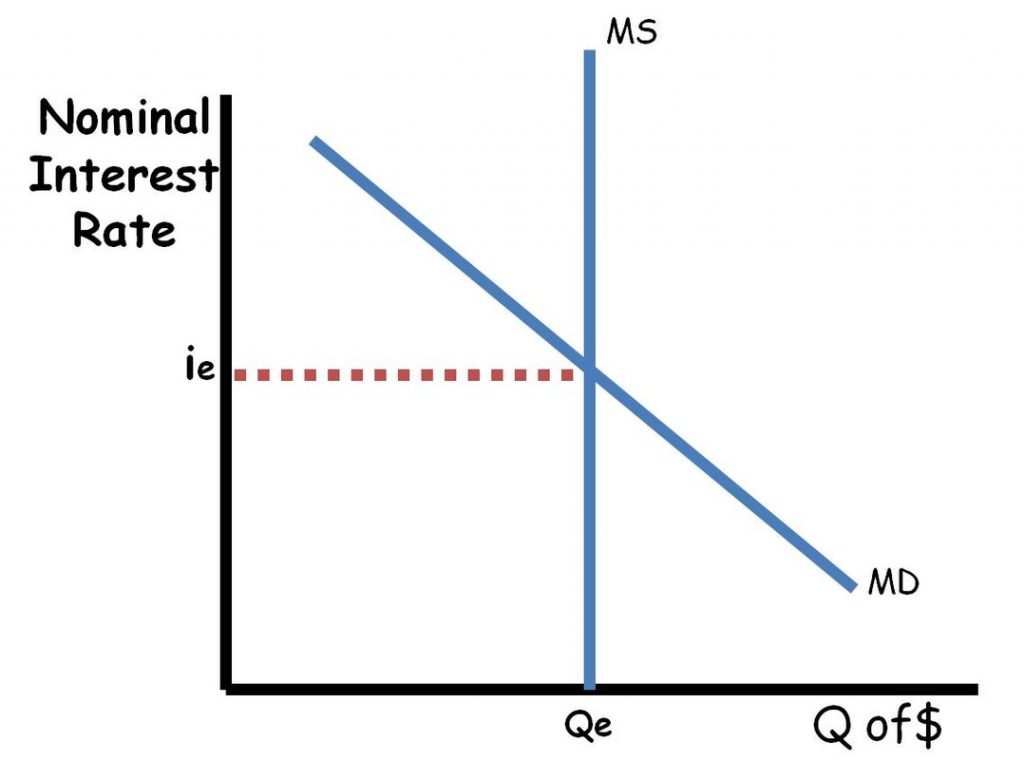
•MS is the amount of money in the economy as calculated by M1 or M2. •The Federal Reserve (AKA Central Bank) regulates the money supply through open market operations (buying and selling bonds or securities), discount rate, reserve requirement. •Expansionary monetary policy shifts the MS right. •Contractionary monetary policy shifts the MS left. •The MD can move because of a change in the number of transactions in an economy (C+Ig+G+Xn) or a change in the desire to hold cash as an asset.
•The SRPC shows the inverse relationship between the inflation rate and the unemployment rate. •The LRPC lies at the Natural Rate of Unemployment (full employment). •The intersection between the SRPC and the LRPC is the expected rate of inflation. •When an economy is in long-run equilibrium the inflation rate will be at the intersection between the LRPC and the SRPC. •Changes in AD will cause movement along the SRPC. •Changes in AS will shift the SRPC left or right. •Changes in inflation expectations will cause SRPC to shift left or right.
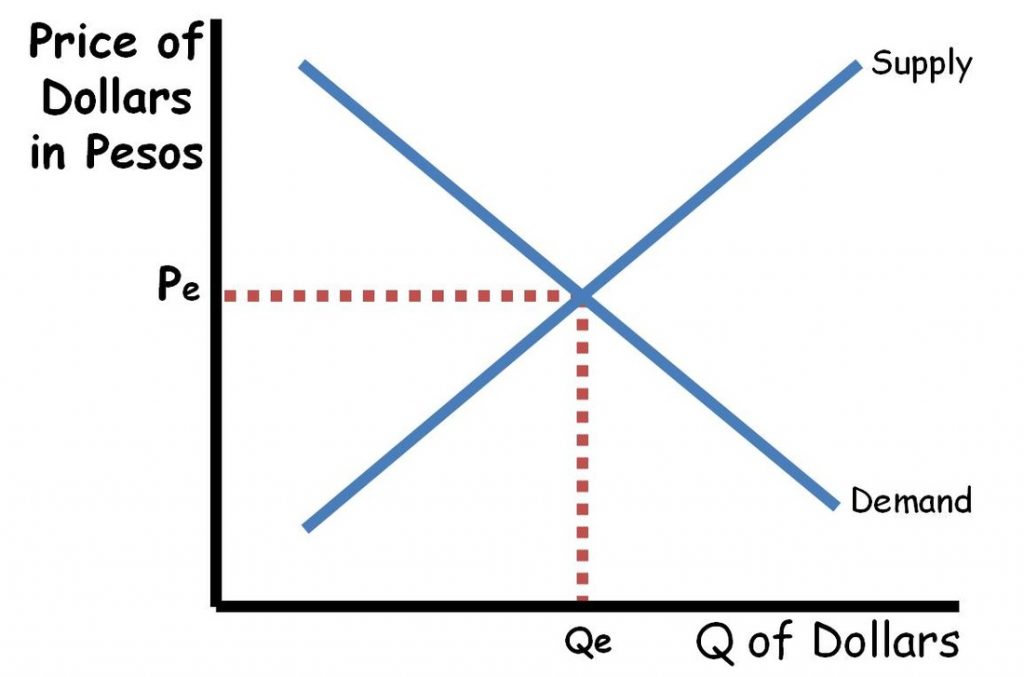
•Supply and demand determine the exchange rates for world currencies. •The demand for a currency will shift because of a:
Change in the interest rate for this country or other countries
Change in the expected future exchange rate
Change in anything that would make foreigners want to have more of this countries currency
•The supply for a currency will shift because of a:
Change in the interest rate for this country or other countries
Change in the expected future exchange rate
Change in anything that would make foreigners want to have more of this countries currency
•Anytime there is an increase in the demand for a currency, there is simultaneously a decrease in the supply of the same currency. And there will be a decrease in the demand for the other currency and an increase in supply of the other currency. ***Remember this is foreign supply and demand for these currencies.
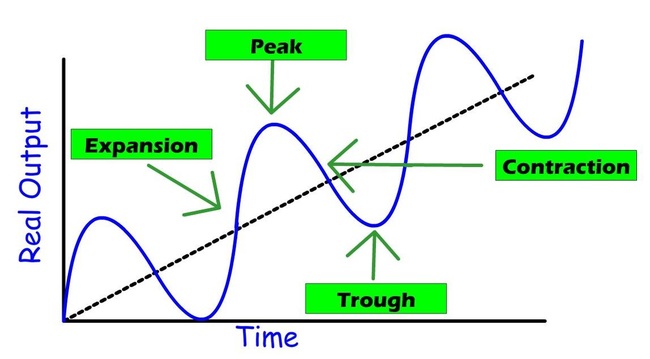
•Natural fluctuations in economic activity over time •Expansion is also called recovery •Peaks coincide with an inflationary gap and may bring high inflation.
•Contraction that last more than 6 months are generally referred to as recessions. •Troughs coincide with a recessionary gap and bring high unemployment and possibly deflation.