
4 keys to the Money Market graph
Updated 11/7/2024 Jacob Reed
1. What is the money market?
The money market is like any other competitive market with just a few differences. It has a supply curve, demand curve, equilibrium price and equilibrium quantity just like a competitive market for any product. There are a few differences you need to know including axis labels and unique supply and demand shifters.
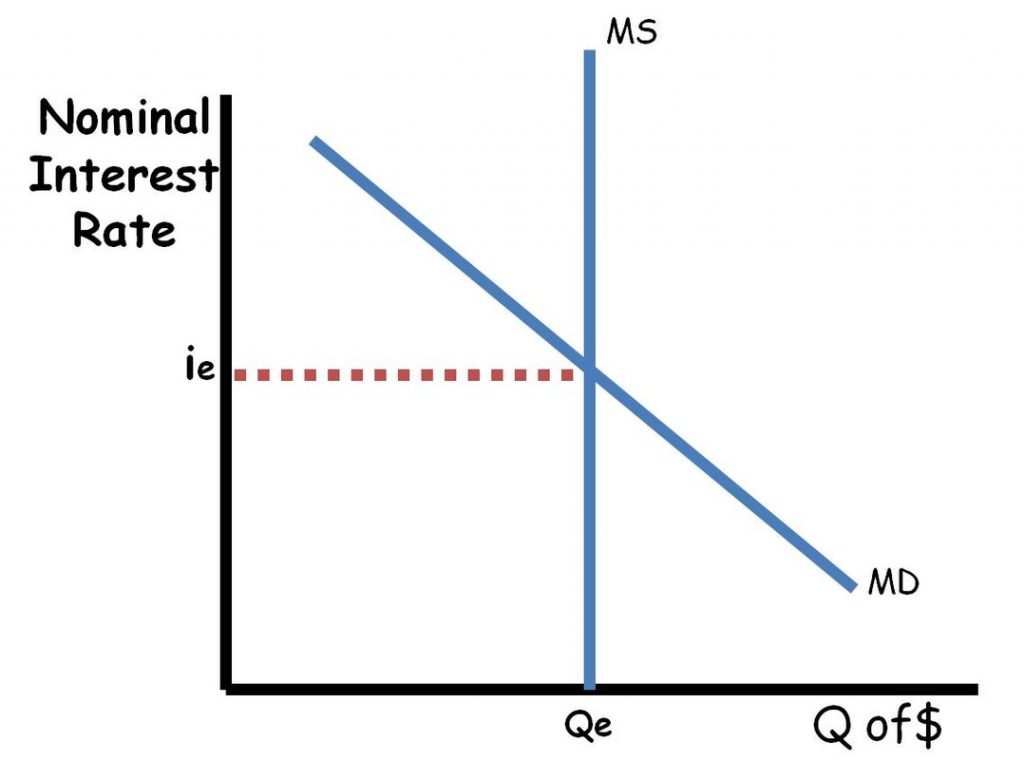
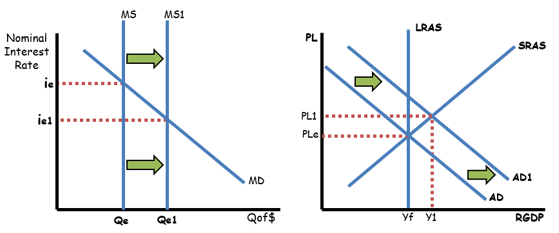
The first distinction for a money market is the axis labels. The Y axis is the nominal interest rate (abbreviated as “i”), which means it has not been adjusted for inflation, instead of price. The X axis is not just the quantity, but the quantity of money. The demand curve in this market is downward sloping and the supply curve is perfectly inelastic (vertical).
2. What is the demand for money?
The demand curve in the money market is comprised of two things: the transaction demand for money and the asset demand for money. The transaction demand for money comes from the money necessary to facilitate the transactions throughout the entire economy. It is equal to nominal GDP. As a result, changing any component of GDP (C+Ig+G+Xn) or the price level changes the transaction demand for money.
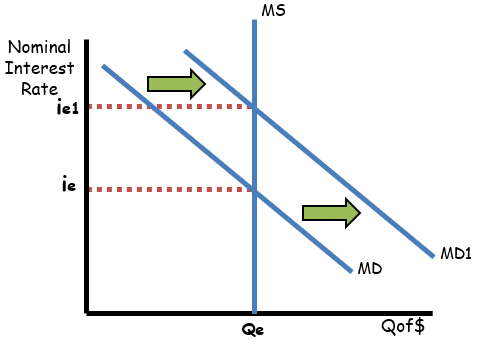
The second component of the money market demand curve, is the asset demand for money. Money has value, and holding it is one way to store wealth. Money is the most liquid asset, but it doesn’t earn any interest. The opportunity cost for holding money is the interest rate that could have been earned if the money were saved in a CD, money market, savings account, etc. With higher interest rates, less money will be held (demanded) as an asset, it will be saved instead. With lower interest rates, more money will be held (demanded) as an asset. As a result of this inverse relationship between the quantity of money demanded as an asset and the nominal interest rate, the money market demand curve is downward sloping. The asset demand for money will change with anything that impacts people’s desire to hold their wealth as money (like an unstable stock market, etc). Changes in the transaction demand for money or the asset demand for money shift the demand curve for money. Increases shift to the right, and decreases shift to the left.
3. What is the supply of money? (For a limited reserves system only)
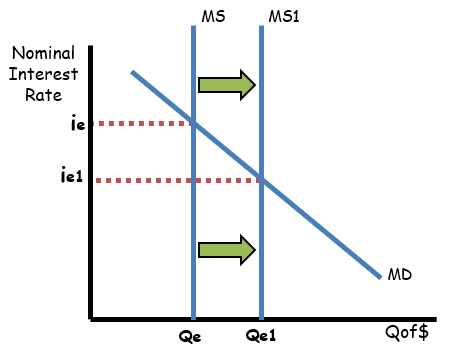
The money supply, on the other hand, is not impacted by the interest rate so it is perfectly inelastic. The money supply is controlled by the central bank. The central bank uses monetary policy to change the money supply and influence the equilibrium nominal interest rate. The monetary policy tools the central bank has at its disposal are the discount rate, the reserve requirement, and open market operations.
The discount rate is the interest rate banks are charged when they borrow from the central bank. Raising the discount rate decreases the money supply and lowering it increases the money supply. The reserve requirement is the percentage of checkable deposits (demand deposits) the bank may not loan out. Increasing the reserve requirement decreases the money supply and decreasing the reserve requirement increases the money supply. Open market operations is the buying and selling of bonds or securities by the central bank. Buying securities increases the money supply, and selling securities decreases the money supply. The actions of the central bank change the nominal interest rate which changes gross investment (Ig) shifting the AD curve in the AS/AD model of the economy. All of these actions of the central bank are also closely tied to the Balance Sheets of individual banks so make sure you study up on those as well.
4. How does the nominal interest rate impact the price of bonds?
The nominal interest rate found on the money market graph as well as the real interest rate found on the loanable funds market graph impact the price of bonds. Interest rates and bond prices are inversely related so as interest rates rise, bond prices fall and vice versa. To understand why, take an example of a bond that originally sold for $1000 and pays $50 per year (this bond will have no expiration date for simplicity). At the time the bond was issued, it paid 5% interest. If the equilibrium interest rate falls to 2.5%, newly issued bonds with a price of $1000 would pay just $25 per year. As a result, the previously issued bond paying $50 per year would now be worth $2000. If the equilibrium interest rate rises to 10%, newly issued $1000 bonds would pay $100 per year. The previously issued bond paying $50 per year would only be worth $500 now.
5. What connections does the money market have to other models?
In the AS/AD model, lower nominal interest rates (perhaps from the central bank buying bonds) cause an increase in gross investment. That increase in gross investment causes a rightward shift of the aggregate demand curve which increases the price level and decreases unemployment (increases real output). If nominal interest rates increase, that causes a decrease in gross investment. Then, the aggregate demand curve shifts left, prices levels fall, and unemployment increases (real output decreases).
If the central bank decreases the money supply (sells bonds), there will be a decrease in gross investment and the AD curve will shift left.
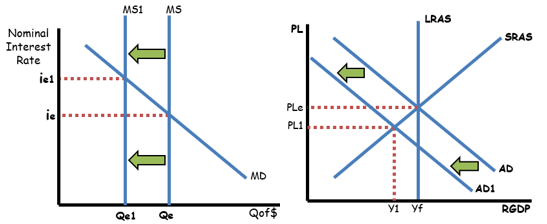
So what happens in the long run when there are changes in the nominal interest rate? The answer is it depends on what the particular test question is asking about. Generally, there will be no impact on real output. That is because in the long run, wages are flexible. If the money supply increases, aggregate demand will shift right and output will increase in the short run. In the long run, wages will adjust to the higher price level and that will cause a leftward shift of the short run aggregate supply curve. As a result, there is only an increase in price levels with no increase in real output in the long run.
If a question focuses on increased investment (which increases capital formation) from an increased money supply, there could be a rightward shift of the long-run aggregate supply curve.
In the Foreign Exchange Market, an increase in the US interest rate will cause financial capital to flow into the United States as foreign investors seek a higher interest rate. Foreign investors must purchase US dollars. That increases the demand for US dollars (and decreases the supply) and causes the US dollar to appreciate.
Up Next:
Review Game: Money Market Review Activity
Graph Drawing Practice: Money Market
Content Review Page: Phillips Curve Graph
Outside Resource: ACDC