
GDP Deflator and CPI
Updated 5/15/2020 Jacob Reed
The prices of goods and services tend to increase over time. We call that rate of price increase inflation and it has real consequences for the economy. When inflation rates are high, the value of saved money diminishes, decreasing the real value of people’s wealth.

An important goal of macro-economy is stable prices. That is why the government tracks the inflation rate using a variety of measures. The two most commonly used measures (the CPI and the GDP deflator) are discussed below.
When prices fall, that is called deflation. Deflation can also wreak havoc on an economy as it causes a decrease in real wages and increases debt burdens.
Note: Another key term you may need to know is disinflation. That is when an economy goes from having a high rate of inflation (like 20%) to a lower rate of inflation (like 5%) prices are still rising, but at a slower rate.
What is the difference between the GDP Deflator and the CPI?
The most commonly used measure of inflation is the CPI (Consumer Price Index). It tracks price changes in about 80,000 different goods and services bought by a typical urban household. The CPI indicates the impact of inflation on average consumers.
The GDP deflator tracks price changes on all goods and services throughout the entire economy and not just those purchased by average consumers. The GDP deflator is a more comprehensive measure of price levels but might not accurately reflect inflation’s impact on average citizens.
Real vs Nominal GDP
Nominal values are not adjusted for inflation. Real values have been adjusted for inflation. Multiply the prices times the quantities for all goods and services produced within an economy, then add all the values together and you get the nominal or real GDP (depending on which year’s prices are used).
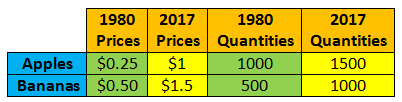
To calculate nominal GDP, current year prices and current year quantities are both used. Take a look at the chart below which shows the prices and quantities of production for a country that produces nothing but apples and bananas:
In 1980, the nominal GDP for this country was $500. ($0.25 x 1000) + ($0.50 x 500) = $500. In 2017, the nominal GDP was $3000. ($1 x 1500) + ($1.5 x 1000) = $3000.
The dramatic increase in nominal GDP is somewhat misleading because there were also dramatic price increases between 1980 and 2017. To get a more accurate picture of what happened to this country’s output, calculate and compare real GDP (adjusting for inflation) for both years.
To calculate real GDP, the base year prices and current year quantities are used. Using the numbers above, the 1980 Real GDP is still $500 because the base year and current year are the same. The real GDP for 2017 is $875. Comparing real GDP between years is a better reflection of the true change in an economy’s output.
Calculating and Using GDP Deflator
The GDP deflator is an index that tracks price changes from a base year. To calculate the GDP deflator, the formula is Nominal/Real x 100.
In the example above the GDP Deflator for 1980 is 100 ($500/$500 x 100 = 100). The GDP deflator for the base year is always 100. The GDP deflator for 2017 is 342.86 ($3000/$875 x 100 = 342.86).
To convert nominal value to real values the formula is Nominal/Deflator x 100. So if the nominal GDP is $1200 and the GDP Deflator is 150, the real GDP will be $800 ($1200/150 x 100 = $800).
Calculating and Using a Consumer Price Index
The consumer price index tracks price changes in a market basket of goods instead of all goods within an economy. To calculate the index, the quantities will never change but you calculate the value of that basket in both the base year’s prices and the current year’s prices. Then the formula is Current Year/Base Year x 100.
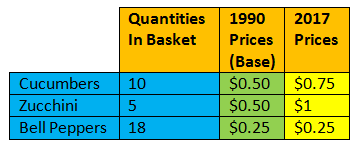
The value of this market basket in the base year is $12. ($0.5 x 10) + ($0.50 x 5) + ($0.25 x 18) = $12. The value of the market basket in the current year is $17. ($0.75 x 10) + ($1x 5) + ($0.25 x 18) =$17.
That means the CPI for 2017 is 141.67 ($17/$12 x 100).
To convert a nominal value to a real value the index is used in the same way the deflator is used. The formula is Nominal/CPI x 100. So a Television that cost $100 in 2017 would cost $70.59 ($100/141.67=$70.59) in 1990.
Inflation from CPI or Deflator
To calculate the amount of inflation between two deflators or CPIs, you can use the formula for calculating percentage change. That formula is (new-old)/old x 100. If the CPI went from 125 to 150, the amount of inflation would be 20%. 150-125/125 x 100= 20%.
Problems with the CPI
The CPI is the most commonly used measure of inflation because it is believed to be an accurate reflection of how price changes impact average citizens. That is because it tracks price changes in a market basket of goods bought by average urban consumers. But the CPI isn’t perfect because of substitution bias, quality change bias and new goods bias.
Substitution bias is the CPI’s failure to account for the substitution effect (you may have learned about that in Micro). For many consumers, when the price of a particular good increases, that consumer will buy something similar. If, for example, the price of tomatoes increased, a consumer might purchase cucumbers instead. The increase in the price of tomatoes may be reflected in the CPI, but that price increase didn’t actually get paid by the consumer.
The quality change bias is the CPI’s inability to accurately reflect the fact that many products get better over time (they may also get worse). Those changes in quality are not always reflected in the CPI despite the government’s attempts to correct for them.
Last of all, the new goods bias is a criticism based on the fact that the CPI is based on a fixed market basket of goods. As consumer spending habits change, those changes are not immediately reflected in the CPI.
For more on the criticisms and explanations of these issues see the Bureau of Labor Statistics.
The Costs of Inflation
Many people think inflation within an economy hurts everyone, but that isn’t true. The fact is, inflation hurts some people and helps others. People on fixed incomes (like retired citizens) will be hurt when prices rise as they do not have the ability to earn more money to pay for higher prices. Savers are hurt as well since their money becomes worth less over time. Lenders and bankers also lose when there is unexpected inflation as borrowers pay back loans with less valuable dollars (fewer real dollars).
The primary group who benefits from unexpected inflation are debtors (people who borrow money). If Sally takes out a loan at 5% interest when the expected rate of inflation is 2%, she expects to pay a real interest rate of 3%. If the actual inflation rate ends up being 4%, then Sally will pay back the loan with less valuable money (fewer real dollars) and the real interest rate she pays will be just 1% instead of the expected 3%. For more on who wins and loses with inflation see the Fisher formula page in the financial sector unit.
Up Next:
Review Game: CPI and Deflator Calculations
Content Review Page: Types of Unemployment
Other recommended resources: ExamPop, ThinkWellVids